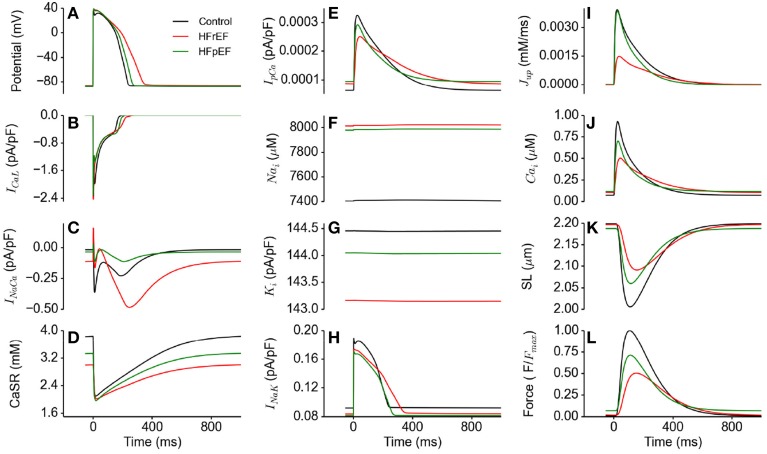
Figure 4.
Effects of HFpEF and HFrEF on underlying ion channel currents, concentrations and force generation. (A) Control (black), HFpEF (green), and HFrEF (red) action potentials. (B) ICaL current profile in control (black), HFpEF (green), and HFrEF (red). (C) INaCa current profile in control (black), HFpEF (green), and HFrEF (red). (D) SR Ca2+ content profile in control (black), HFpEF (green), and HFrEF (red). (E) IpCa current profile in control (black), HFpEF (green), and HFrEF (red). (F) [Na]i time course in control (black), HFpEF (green), and HFrEF (red). (G) [K]i time course in control (black), HFpEF (green), and HFrEF (red). (H) INaK current profile in control (black) HFpEF (green), and HFrEF (red). (I) Jup (Ca2+ uptake via SERCA pump) profile in control (black), HFpEF (green), and HFrEF (red). (J) Ca2+ concentration in Control (black) HFpEF (green), and HFrEF (red) cytosolic. (K) Sarcomere length (SL) in control (black), HFpEF (green), and HFrEF (red). (L) Active force in control (black), HFpEF (green), and HFrEF (red). Values are normalized to Control maximum active force.

