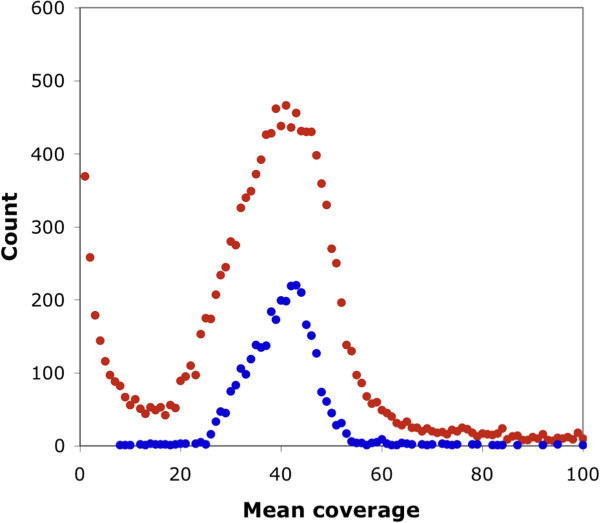
Figure 2.

Coverage of transcripts. Sequencing reads were mapped to all putative transcripts (red points) and a median group of 3310 transcripts (blue points). The reduced set of transcripts was filtered to exclude repetitive sequences and incomplete sequences. The genome size was estimated from the peak of the lower distribution.
