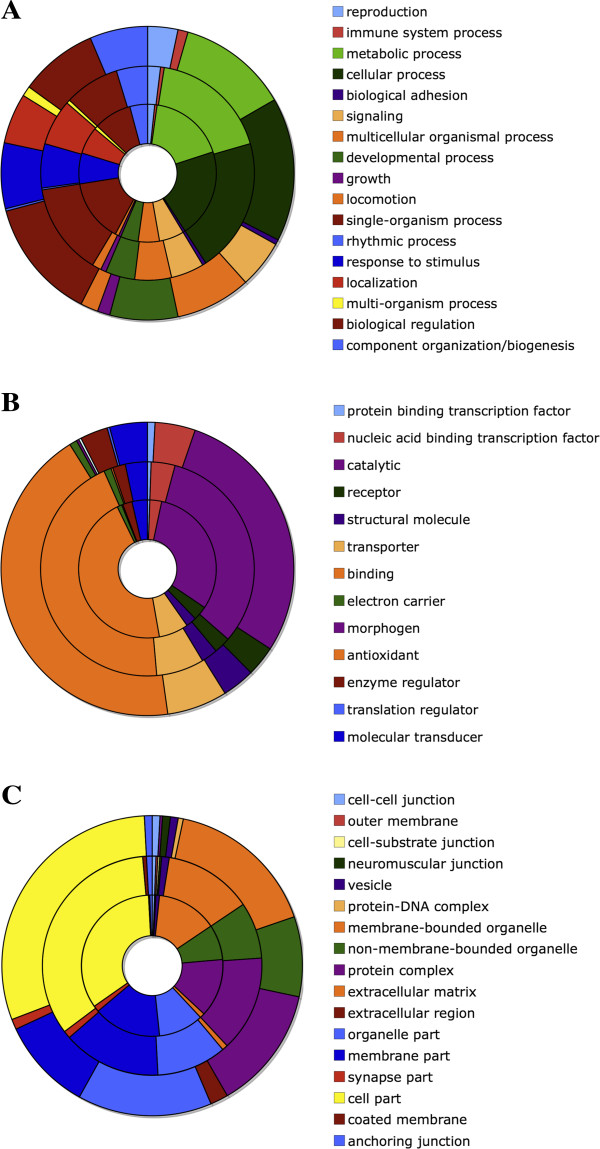
Figure 4.

Gene Ontology comparison. Each graph compares the classification of the putative B. tryoni transcripts (outer ring) with the annotations of C. capitata (middle ring) and D. melanogaster (inner ring). Panel A: Biological processes. Panel B: Molecular Function. Panel C: Cellular components. The relative distributions support the conclusion that the assembly contains a near-complete assembly of coding DNA.
