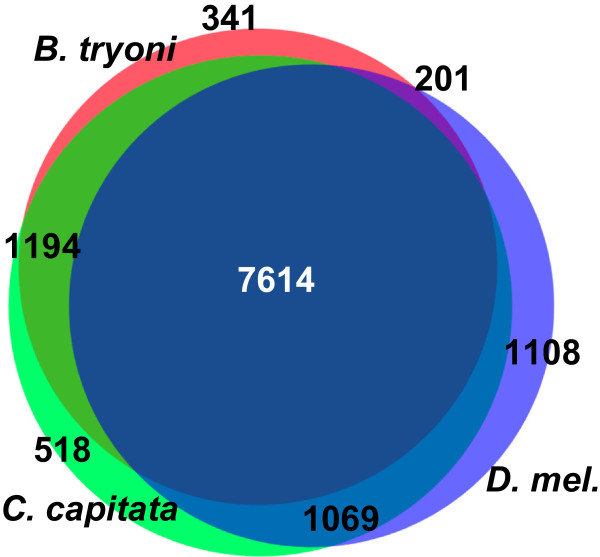
Figure 5.

Overlap of protein orthologous groups for B. tryoni , C. capitata and D. melanogaster . The gene models for all three species were grouped according to similarity using OrthoMCL. The Venn diagram shows the number of groups that included gene models from either one, two or three of the species. Areas of overlap are proportional to the counts shown. For all three species, 2-4% of gene models occurred in species-specific groups.
