
Figure 3.
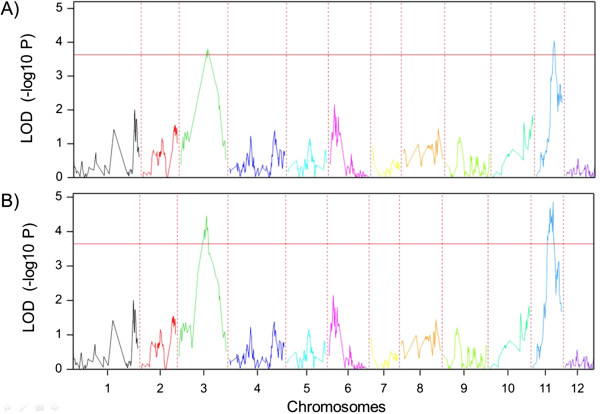
QTL mapping of qTy-p3 and qTy-p11 (Chromosome 3 and Chromosome 11) conferring resistance to TYLCV from S. pimpinellifolium G1.1554. Y-axis represents values according to the interval mapping, horizontal red line delimits threshold of 3.6. A) QTL mapping in GenStat only with the SNPs obtained from the SNP array. B) QTL mapping after the inclusion of more SNP information obtained from sequences in chromosomes 3 and 11.