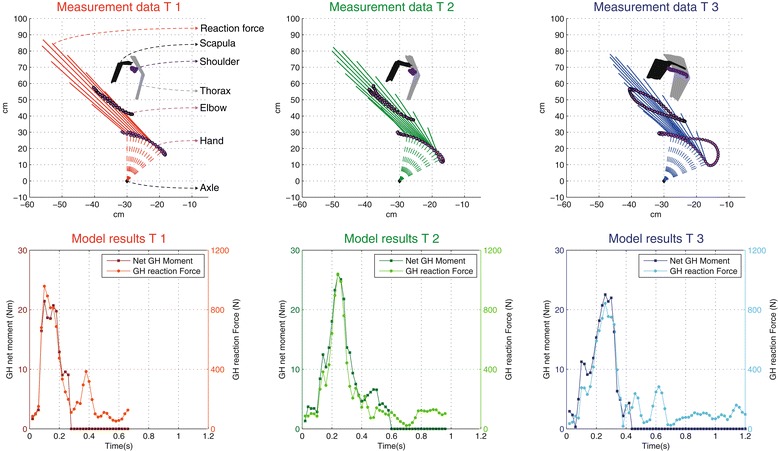
Figure 3.

Typical example of one push cycle for each trial (row 1) and consequent DSEM outcomes (row 2) over the 12 min natural learning period, derived from the input from the T1, T2 and T3 measurements. The 1st (top) row shows the kinematic and kinetic input (reaction force vector) for the model in relation to the trajectories of the shoulder, elbow and hand over the push and recovery phase (Cycle) at T1, T2 and T3. The 2nd row shows the shoulder loading as expressed in both total net moment (Nm) and total joint reaction force (N) over this same cycle at T1, T2 and T3.
