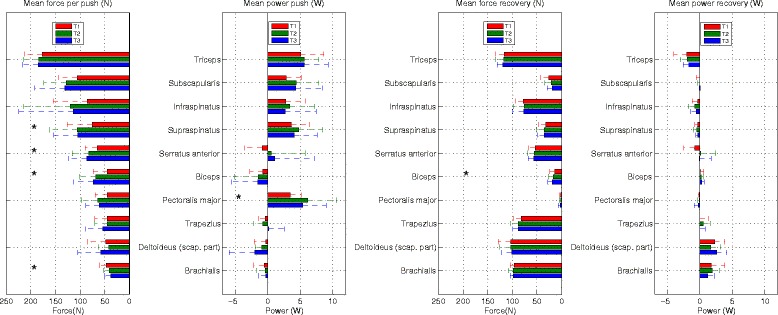
Figure 6.

Outcomes (n = 15; mean +/−sd) of the DSEM for individual muscle forces (N) and powers (W) during the push (left) and recovery (right) phases over time (T1-T3). Only depicted are those muscles that had mean muscle forces during the push phase larger than 25 N.
