Figure 7.

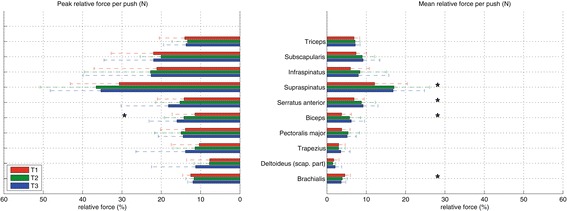
Relative mean forces (n = 15) of individual muscles during the push phase. The error bars represent the standard deviation. Only depicted are those muscles that had mean muscle forces during the push phase larger than 25 N.

Relative mean forces (n = 15) of individual muscles during the push phase. The error bars represent the standard deviation. Only depicted are those muscles that had mean muscle forces during the push phase larger than 25 N.