
Figure 5.
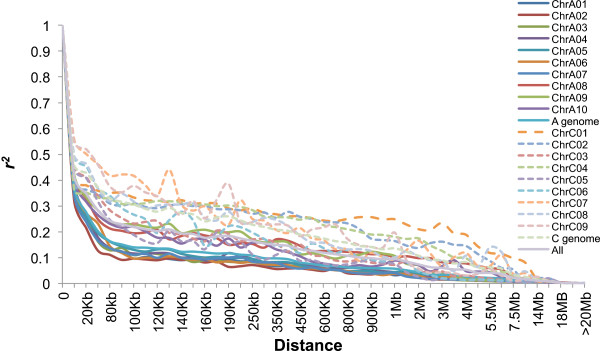
Patterns of linkage disequilibrium (LD, r 2 = 0.1) across the 19 haploid chromosomes of semi-winter type B. napus , measured with 24,994 single-copy SNP markers. The solid lines represent LD decay in A-subgenome chromosomes, while the dashed lines represent LD decay in C-subgenome chromosomes.