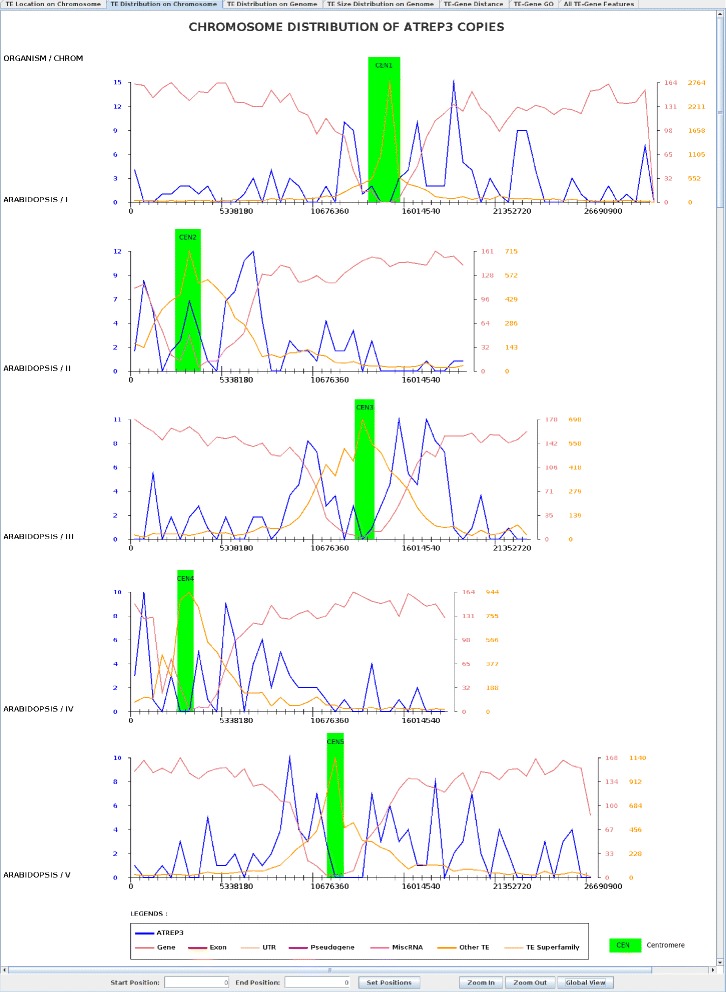
Figure 2.

AtREP3 distribution in Arabidopsis thaliana . AtREP3, ‘All TEs,’ and gene distribution along the chromosomes are colored blue, orange, and light red, respectively. The same color code is used for the Y-scale. Centromeric regions from [22] are shown in green rectangles.
