
Figure 1.
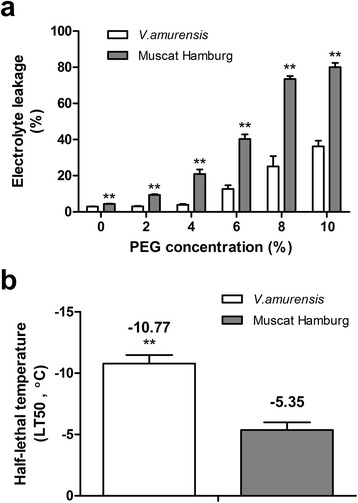
Electrolyte leakages (a) under different concentrations of PEG for one day and electrolyte leakages based LT50 values (b) of grape leaves subjected to low temperature of V. amurensis and ‘ Muscat Hamburg’ plantlets. The values represent the mean value±SE from five replicates and **indicates significant differences between V. amurensis and ‘Muscat Hamburg’ at P<0.01 level (t test).