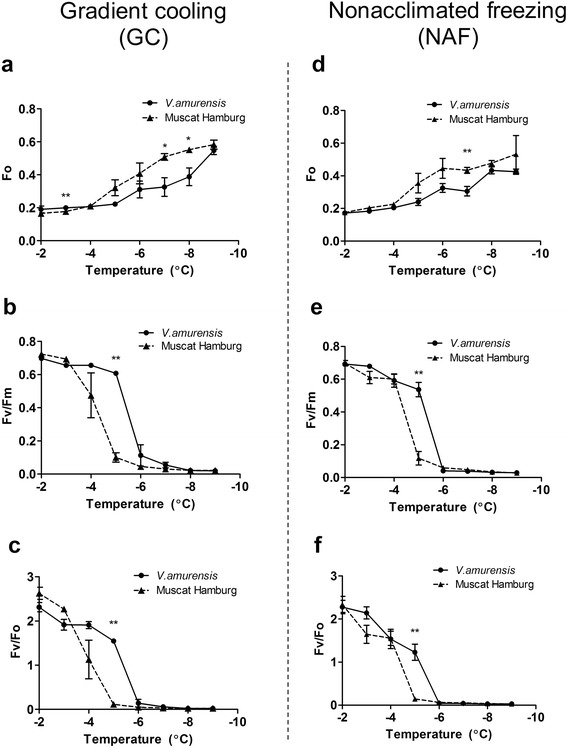
Figure 3.

Chlorophyll fluorescence response of V. amurensis and ‘Muscat Hamburg’ under two combined drought−cold stress modes. (a)−(c) indicate the response of Fo (a), Fv/Fm (b) and Fv/Fo (c) to gradient cooling (GC) mode, while (d)−(f) represent the response of Fo (d), Fv/Fm (e) and Fv/Fo (f) to non−acclimated freezing (NAF) mode. The values were the mean value±SE of three replicates, and * and ** indicate significant differences between V. amurensis and ‘Muscat Hamburg’ at P<0.05 and P<0.01 level (t test), respectively.
