Figure 7.

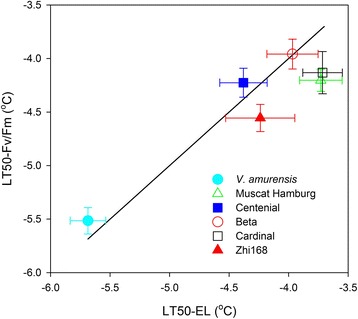
Correlation between LT50 calculated based on EL and that calculated based on Fv/Fm in six different grape genotypes. The values were the mean±SE of three replicates. The 1:1 line is presented.

Correlation between LT50 calculated based on EL and that calculated based on Fv/Fm in six different grape genotypes. The values were the mean±SE of three replicates. The 1:1 line is presented.