
Figure 6.
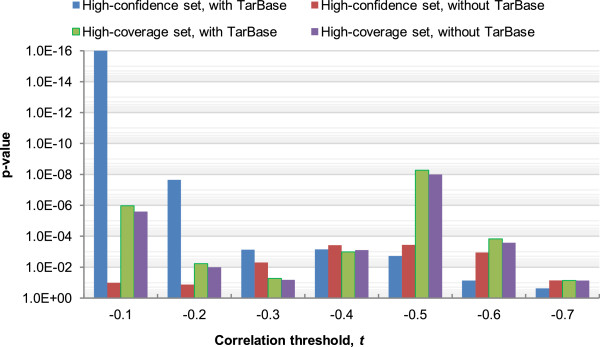
Comparing MTBs with the miRNA regulatory modules (MRMs) identified by the Yoon and De Micheli method. The p-values were computed by comparing the fractions of correlations more negative than the threshold t of miRNA-mRNA pairs within MTBs, as compared to those from the MRMs. In the figure, 1E-16 represents the smallest p-value that could be outputted by our program.