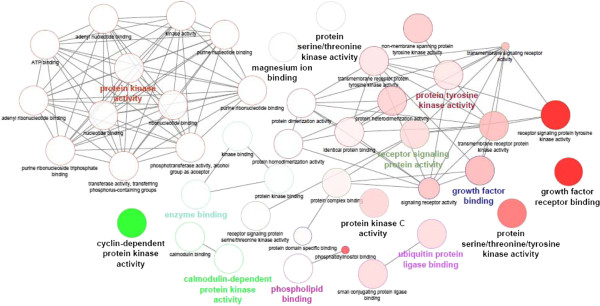
Figure 6.

Ontologic annotation of PPI networks. Comparative annotation of PPIs from the low- and high-MI groups was performed using ClueGO tool as Cytoscape plug-in. Results are expressed as a graph of differential enrichment of molecular function GO terms. The color gradient shows the kinase proportion of each cluster associated with the term (green nodes for the high-MI group and red nodes for the low-MI group). Equal proportions of the two clusters are represented as white nodes.
