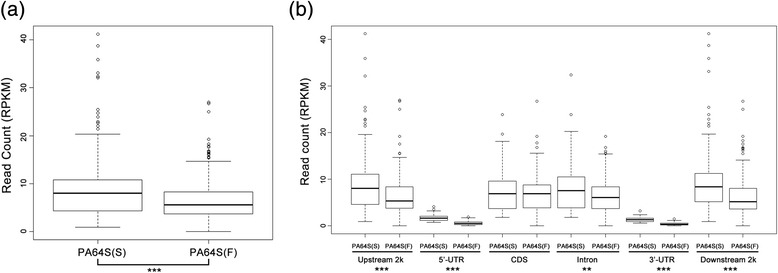
Figure 4.

Boxplots showing the 5mC content (read count, y axis) in 1 kb tiled windows for PA64S(S) and PA64S (F). (a) Total reads of PA64S(S) and PA64S (F); (b) Reads for each elements of PA64S(S) and PA64S (F). The asterisks indicate significant differences between PA64S(S) and PA64S (F), as determined by Student’s t test (**P < 0.01, ***P < 0.001).
