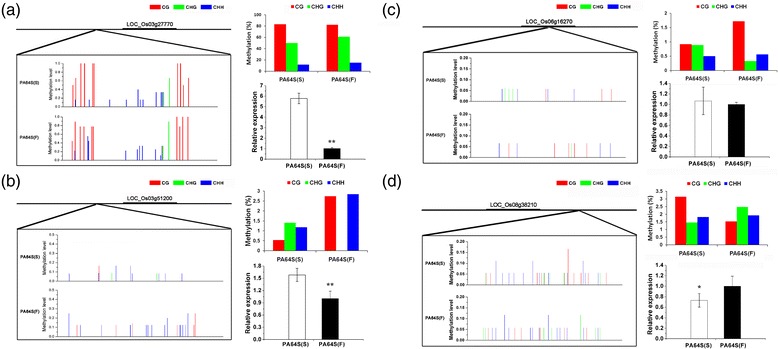
Figure 6.

DNA methylation patterns and gene expression of the four selected DMR-associated genes. (a) Bisulfite sequencing and qRT-PCR analysis of LOC_Os03g27770 (heme oxygenase 2); (b) Bisulfite sequencing and qRT-PCR analysis of LOC_Os03g51200 (H2A); (c) Bisulfite sequencing and qRT-PCR analysis of LOC_Os06g16270 (heat shock factor binding protein 2); and (d) Bisulfite sequencing and qRT-PCR analysis of LOC_Os08g38210 (transcription factor BIM2). The red, green and blue columns in the histograms refer to the collective methylation levels (in percentage) of CG, CHG, and CHH, respectively.
