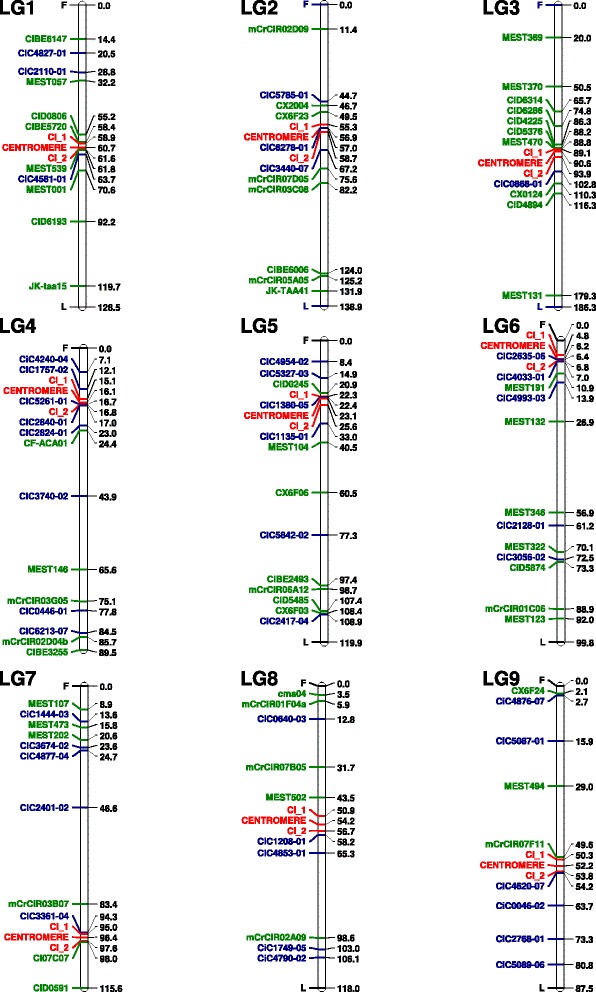
Figure 3.

Location of centromeres on the current clementine genetic map using HTA and drop-off calculations of the confidence interval. Markers F and L correspond to the first and the last marker for each LG. Green and blue indicate SSR and SNP markers, respectively. Locations of centromeres and CI are highlighted in red.
