
Figure 5.
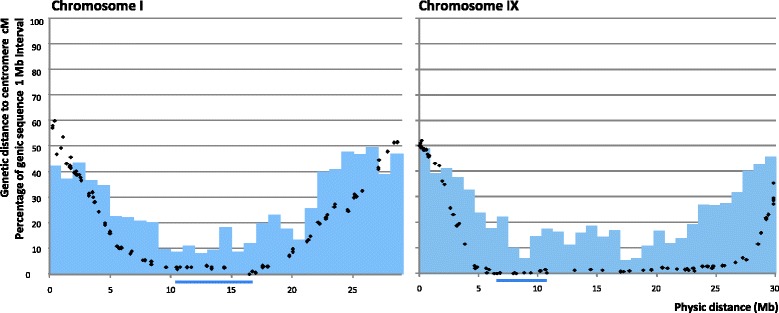
Relationship between physical location (x-axis), genetic distances between the centromere and markers on the clementine genetic map (black dots) and proportion of genic sequences (blue bars) along chromosomes I and IX. Bars beneath the x-axis indicate the approximate location of the centromeres (CI).