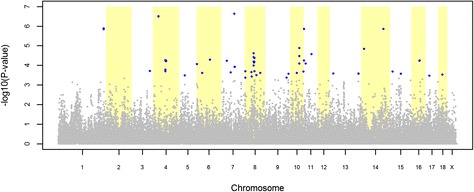
Figure 2.

Association between cryptorchidism and 39 508 genome-wide SNPs in a Landrace pig population. Each dot represents one SNP; on the y-axis are -log10(P-values), and on the x-axis are the physical positions of the SNPs by chromosome; blue dots represents SNPs that surpassed the FDR ≤ 0.20 threshold.
