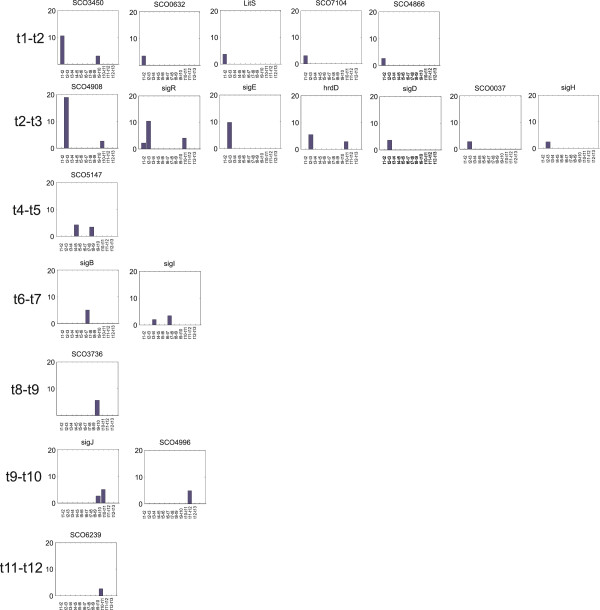
Figure 6.

Differential expression profiles of sigma factors induced during germination. Sigma factors are sorted according to the time point in which their expression was enhanced (top – down) and the fold-increase in expression level between consecutive time points (right – left, vertical axis). Only intervals with significant changes are displayed.
