Fig. 1.

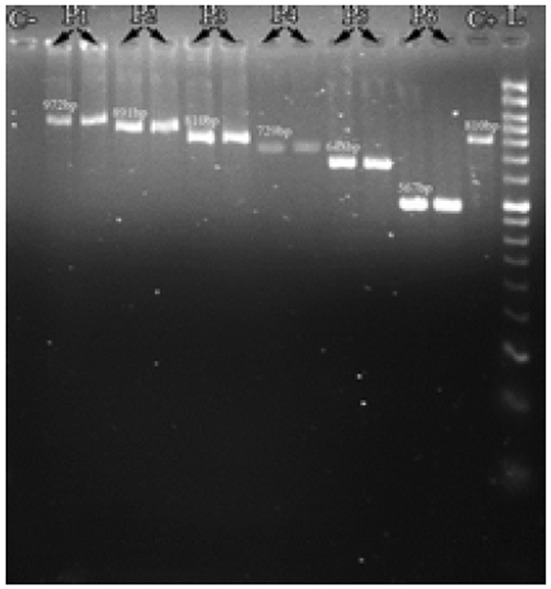
Representative agarose gel electrophoresis image of coagulase gene PCR products. L: 50bp DNA ladder, C-: Control negative, C+: Control positive, P1: 972, P2:891, P3:810, P4:729, P5: 648, P6: 567 bp bands

Representative agarose gel electrophoresis image of coagulase gene PCR products. L: 50bp DNA ladder, C-: Control negative, C+: Control positive, P1: 972, P2:891, P3:810, P4:729, P5: 648, P6: 567 bp bands