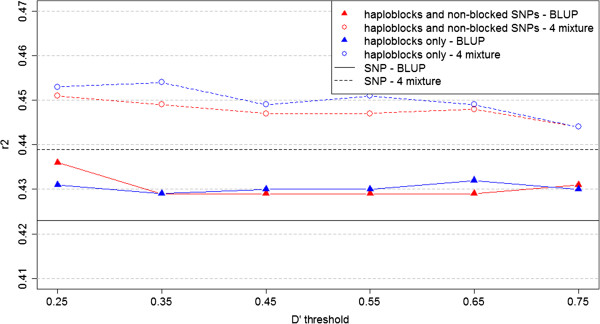
Figure 2.

Prediction reliabilities
 for milk protein for BLUP and Bayesian mixture models with different
D
′
thresholds. This figure presents the prediction reliabilities of the models performed for milk protein. Black lines, individual SNP approach; red lines, haploblock approach with non-blocked SNPs; blue lines, haploblock approach without non-blocked SNPs. Continuous lines indicate the BLUP models; dashed lines indicate the mixture models.
