Figure 2.

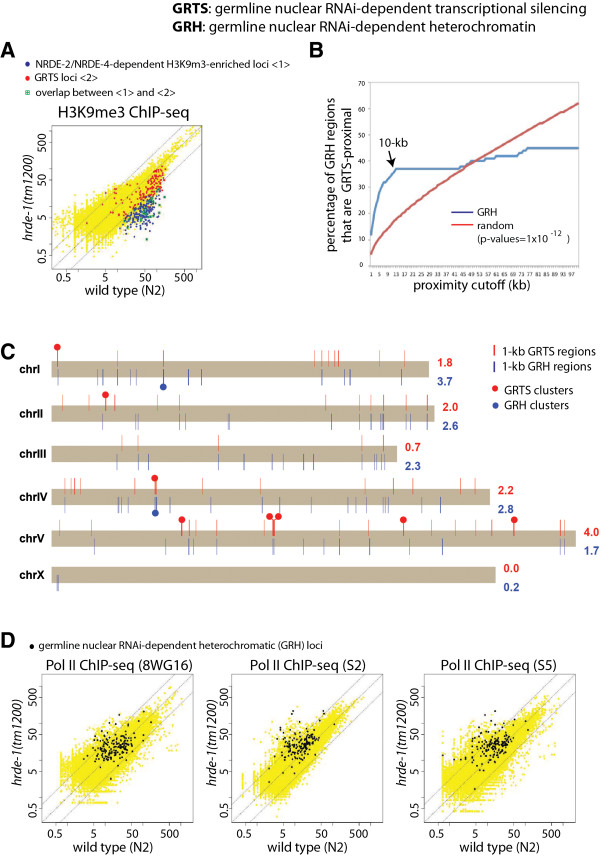
Germline nuclear RNAi-dependent heterochromatic (GRH) regions. (A) H3K9me3 ChIP-seq signals for the wild type (N2) and hrde-1(tm1200) mutant on 100,257 1-kb regions in the C. elegans genome. GRH and GRTS loci were indicated by blue and red dots, respectively. (B) Blue curve: the percentage of the 215 1-kb GRH regions that are nearby to or overlap with any GRTS as a function of the proximity cutoff. Red curve: the minimal percentage to reject the null hypothesis that the 215 1-kb GRH regions have no tendency to overlap with or nearby to GRTS regions (p-values = 1 × 10⁻¹², binomial distribution) as a function of the proximity cutoff. (C) Genomic distribution of GRTS (red bars) and GRH (blue bars) regions in each of the six chromosomes in C. elegans, with prominent GRTS clusters and GRH clusters (at least 10 kb) indicated with solid circles. Numbers on the right of each chromosome are the percentages of the chromosome in GRTS (red) and GRH (blue) regions. (D) Scatter plots of the whole-genome Pol II ChIP-seq signals for the wild type and hrde-1(tm1200) mutant animals with the GRH regions highlighted (otherwise the same data as used in Figure 1B). Dotted lines (A and D ) indicate no-changes (the middle line) and three-fold differences (the flanking lines).
