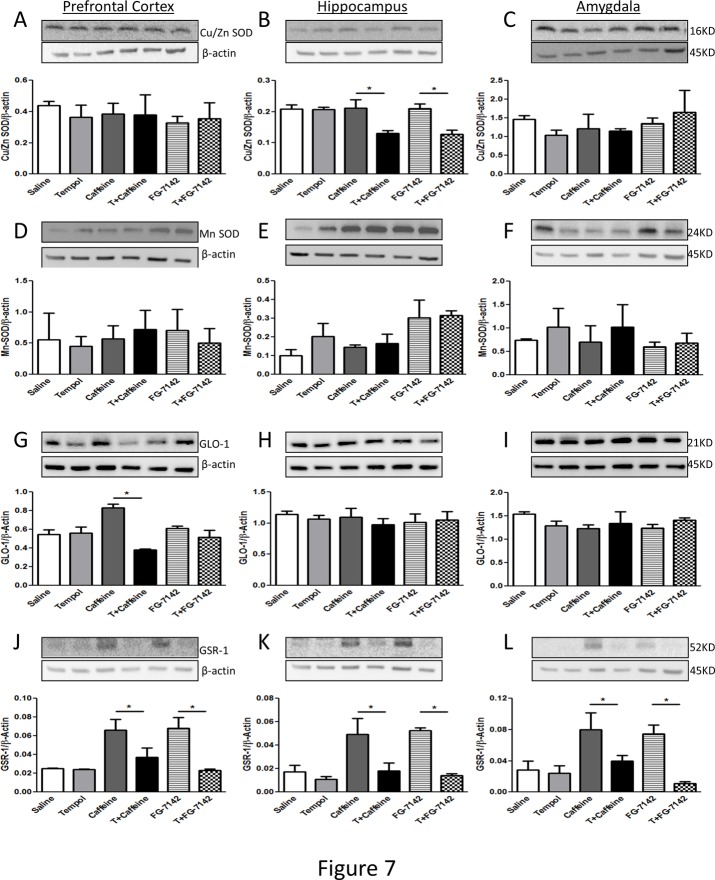
Fig 7. Examination of Cu-Zn SOD, Mn SOD, GLO-1 and GSR-1 protein levels in the prefrontal cortex, hippocampus and amygdala of rats.
Protein levels of Cu-Zn SOD (A-C), Mn SOD (D-F), GLO-1 (G-I) and GSR-1 (J-L) were determined by western blotting. The upper panels are representative blots for Cu-Zn SOD, Mn SOD, GLO-1 and GSR-1 and the lower panels are protein loading control β-actin. Bar graphs are ratios of Cu-Zn SOD, Mn SOD, GLO-1 and GSR-1 to β-actin, respectively. (*) significantly different from control, p< 0.05. Bars represent means ± SEM, n = 3–5 rats/group.

