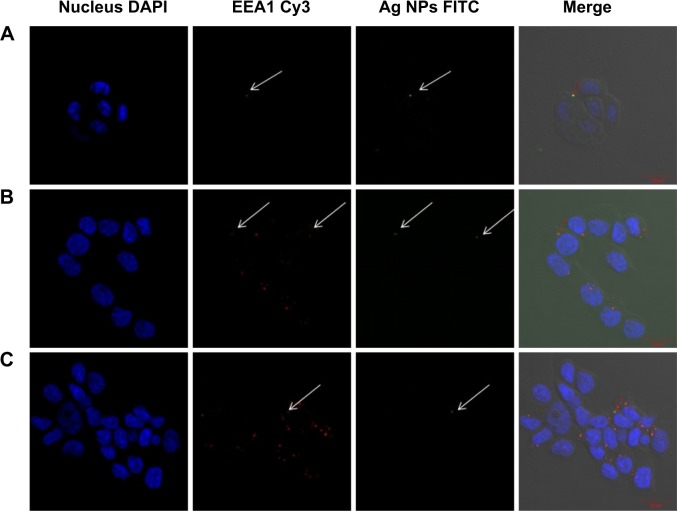
Figure 6.
Fluorescent microscopy images to identify Ag NPs and EEA1.
Notes: The colocalization between EEA1 and AgNPs was observed in the confocal analysis. The arrows show the points with colocalization. Nuclear fluorescence was obtained with DAPI. A and B are MCF7 cells; C are T47D cells.
Abbreviations: DAPI, 4′,6-diamidino-2-phenylindole; FITC, fluorescein isothiocyanate; Ag NPs, silver nanoparticles.

