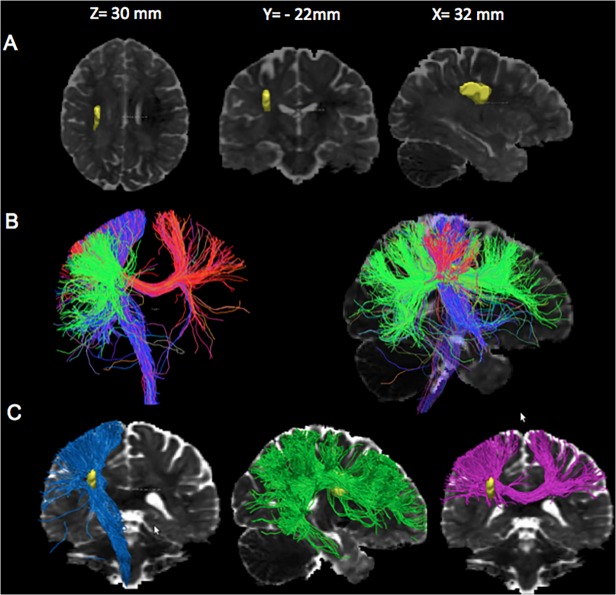
Fig 3. Tracking analysis from the strategic area.
Color code is directional (blue for z-axis, green for y-axis and red for x-axis). A. Superposition of the strategic area (in yellow) on a normalized ADC map. B Association and Projection tracts passing through the strategic area on a coronal view (left image) and on a sagittal view of a normalized ADC map. The color code is directional (pink for the x-axis, blue for z-axis and pink for y-axis). C. Association and Projection tracts travelling though the strategic area (in yellow). Left: The projections tract projections at the top in the following areas: primary motor, premotor, and parietal cortices (blue); Middle: The association tract passing through the yellow region contains part of the superior longitudinal fasciculus (green); Right: The fibers of the corpus callosum passing through the strategic area (pink).

