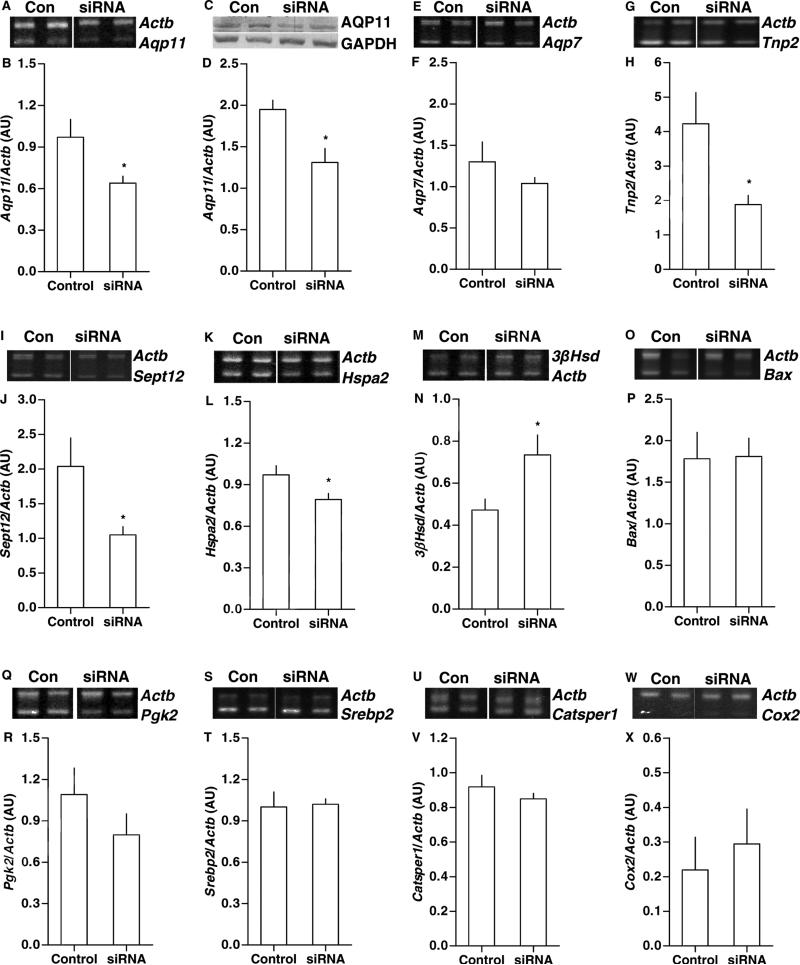
Figure 2. Aqp11 Knockdown effects on testicular expression.
Hamsters were injected with vehicle control (n = 8) or Aqp11 siRNA (n = 16), and assessed for experimental and reference mRNA or protein levels by RT-PCR (with beta-actin (Actb) co-amplification) or Western blot (normalized to GAPDH protein), respectively. Representative bands are shown for agarose or polyacrylamide gel analyses. (A) Aqp11 and Actb. (B) Aqp11/Actb mRNA levels decreased. (C) Western blot analysis of AQP11 and GAPDH. (D) AQP11/GAPDH protein levels decreased. (E) Aqp7 and Actb. (F) Aqp7/Actb mRNA levels did not change. (G) Tnp2 and Actb. (H) Tnp2/Actb mRNA levels decreased. (I) Sept12 and Actb. (J) Sept12/Actb mRNA levels decreased. (K) Hspa2 and Actb. (L) Hspa2/Actb mRNA levels decreased. (M) 3βHsd and Actb. (N) 3βHsd/Actb mRNA levels increased. (O) Bax and Actb. (P) Bax/Actb mRNA levels did not change. (Q) Pgk2 and Actb. (R) Pgk2/Actb mRNA levels did not change. (S) Srebp2 and Actb. (T) Srebp2/Actb mRNA levels did not change. (U) Catsper1 and Actb. (V) Catsper1/Actb mRNA levels did not change. (W) Cox2 and Actb. (X) Cox2/Actb mRNA levels did not change. Means ± SEM are shown in graphs. For siRNA vs control, *p < 0.05.

