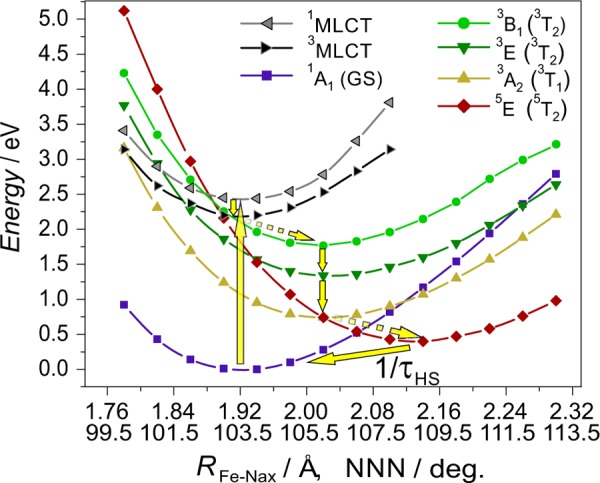
Figure 1.

DFT (1A1, 3A2, and 5E) and TD-DFT (1MLCT, 3MLCT, 3B1, and 3E) potential energy structure of [Fe(terpy)2]2+ along the line connecting the 1A1 and 5E minima; arrows indicate a possible chain of transitions for the full photocycle. The octahedral parent term symbols are also given in parentheses to aid the identification of the metal-centered states. (As the curves for the 5E and 5B2 states on this scale would almost coincide, for clarity only the first one is plotted. Also, in order to keep the figure relatively simple, from each of the 1MLCT, the 3MLCT, and the metal-centered singlet states, only the lowest-lying ones are plotted. Note also that the arrows are only schematic representations of the transitions, particularly between parallel curves, as they cannot represent the coupling by the other vibrational modes between the connected states.)
