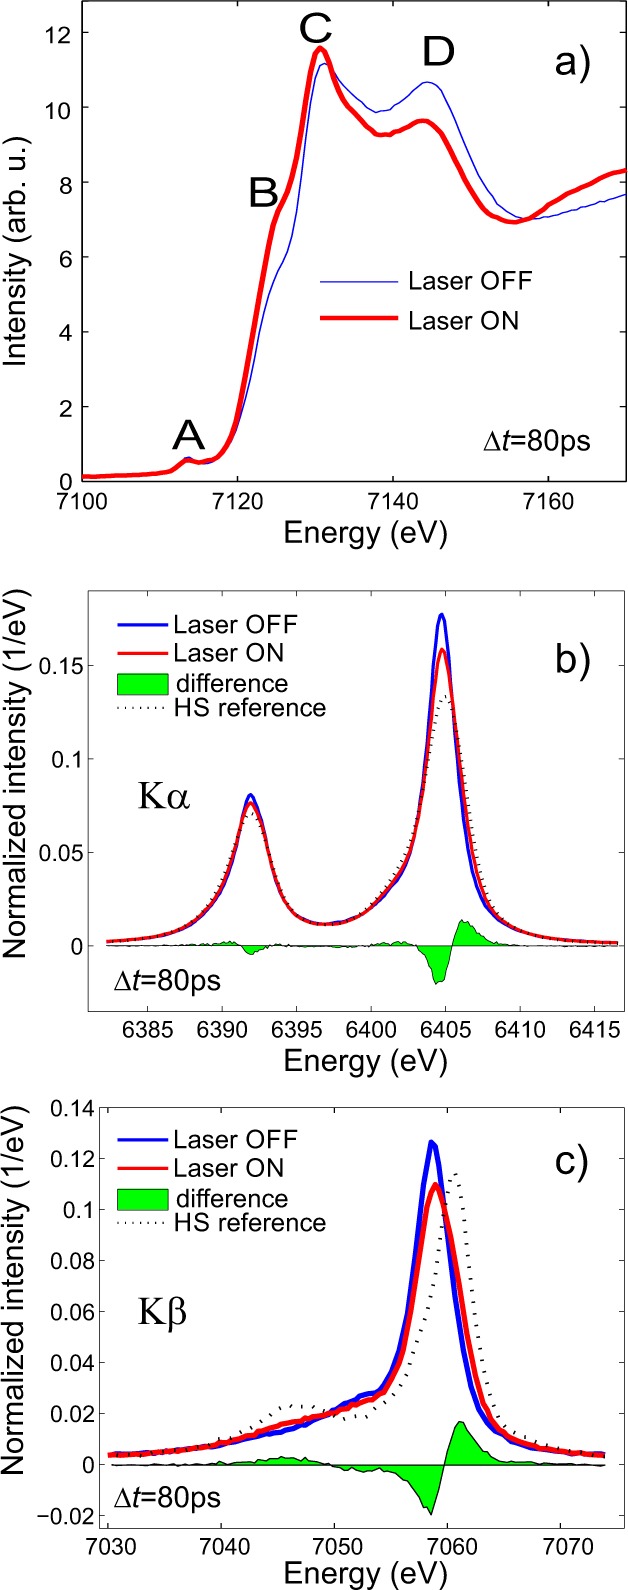
Figure 2.

Fe K-edge TFY-XANES (a), Kα (b), and Kβ (c) X-ray emission spectra of a 13 mM aqueous solution of [Fe(terpy)2]2+, with (red line) and without (blue line) laser excitation, with a time delay Δt = 80 ps for the laser-excited data. The evolution of the intensity of the B and D features, as well as the changes in the emission lines, are the signature of a change from the LS to HS configuration. The photoinduced HS fraction can be determined from XES by comparing the spectra to LS/HS references and was found to be γ = 40%.
