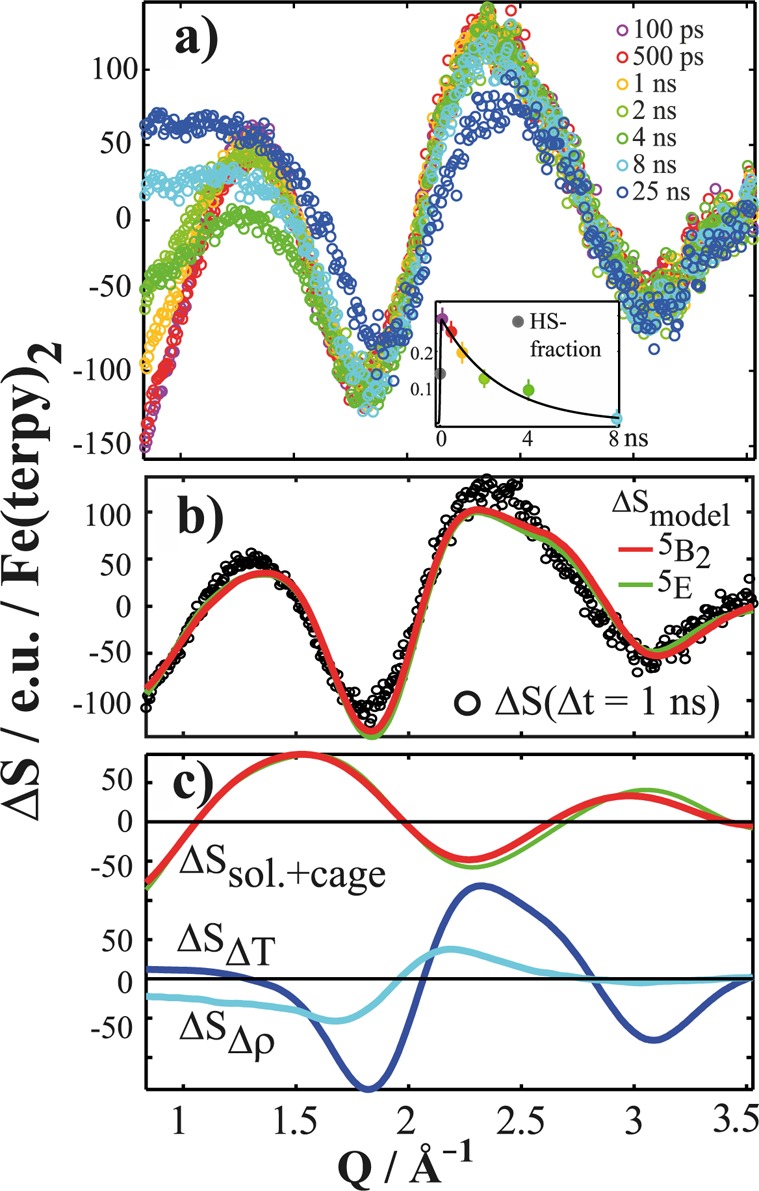
Figure 5.

(a) Set of difference scattering signals ΔS(Q, Δt) acquired for [Fe(terpy)2]2+, color-coded according to time delay. The inset shows the evolution of the HS fraction obtained from the magnitude of the solute-related contribution to the difference scattering signal as a function of time delay. (b) ΔS(Q, Δt = 1 ns) (black circles) and the best-fit simulated difference signal for both of the suggested HS structures (red = 5B2, green = 5E). (c) Each of the three contributions to the simulated difference signal, with the two solute-related difference signals again shown in red (5B2) and green (5E). Bulk solvent contributions are shown in light Δρ × ΔSΔρ and dark blue ΔT × ΔSΔT.
