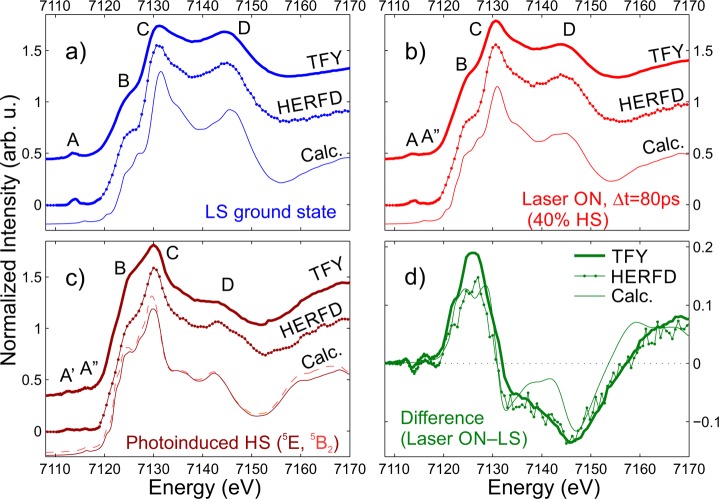
Figure 6.
Experimental and calculated Fe K-edge XANES spectra of (molecular) [Fe(terpy)2]2+. With the experimental data, both detection modes (TFY: thick lines and HERFD: dotted lines) are presented; for the theoretical spectrum (thin line), only the electric dipole contribution is plotted. (a) LS ground state; the theoretical spectrum was calculated using the 1A1 structure. (b) Partially excited [Fe(terpy)2]2+ (Laser ON, Δt = 80 ps); the theoretical spectrum was constructed as a linear combination of the calculated LS (60%) and HS (40%) spectra. (Given the similarity of the two theoretical HS spectra, the reconstruction was done only for the 5E structure for clarity.) (c) Photoinduced HS state of [Fe(terpy)2]2+; the plot shows the experimental spectra reconstructed from the laser ON and LS measurements (utilizing the population from XES) and the theoretical spectra calculated for both possible HS states, 5E (thin line) and 5B2 (dashed line). (d) Transient XANES obtained as the difference of the laser ON–LS (ground state) spectra.

