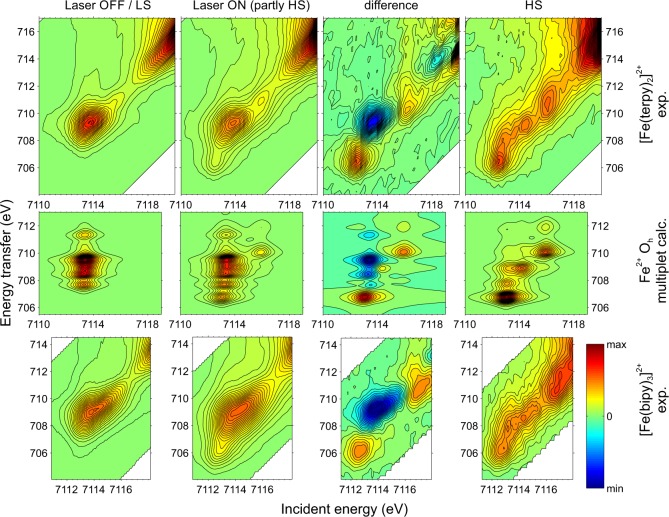
Figure 7.
Experimental Fe 1s2p RXES spectra, from aqueous solutions of [Fe(terpy)2]2+ (top row) and [Fe(bipy)3]2+ (bottom row), showing the ground state, the laser-excited state at 80 ps time delay, their difference, and the reconstructed HS spectra. The theoretical spectra (middle row) were obtained from ligand-field multiplet calculations in an approximate Oh local symmetry, and there the “Laser ON (partly HS)” panel was constructed by the superposition of 40% HS and 60% LS. The spectral intensity is plotted above the plane spanned by the incident energy and the difference between the incident and emitted energy, the energy transfer. The energy scaling is equal for both axes and identical for all the plots in order to aid the comparison.

