Figure 4.
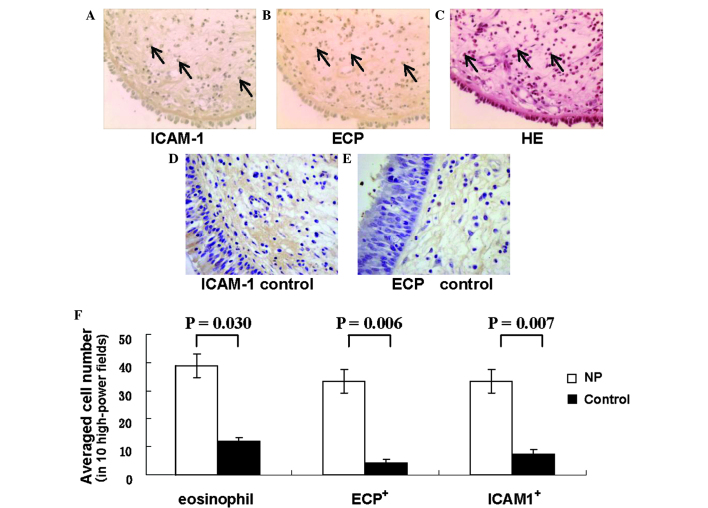
Distribution of total, infiltrating and activated eosinophils in the NP and control nasal mucosa specimens. Representative micrographs of (A) ICAM-1 and (B) ECP immunohistochemistry (brown stain) in NP specimens (magnification, ×200), revealing a large number of ICAM-1+ and ECP+ cells (arrows). (C) A representative micrograph of hematoxylin and eosin-stained NP specimens depicting marked eosinophil infiltration (arrows) of the nasal mucosa (magnification, ×200). Representative micrographs of negative control for (D) ICAM-1 and (E) ECP immunohistochemistry (magnification, ×400). (F) Distribution of total, ECP+ and ICAM-1+ eosinophils in NP and control groups. NP specimens exhibited higher cell counts for total eosinophils (P=0.030), ECP+ cells (P=0.006) and ICAM-1+ cells (P=0.007) than did control specimens. NP, nasal polyposis; ECP, eosinophil cationic protein; ICAM-1, intercellular adhesion molecule-1.

