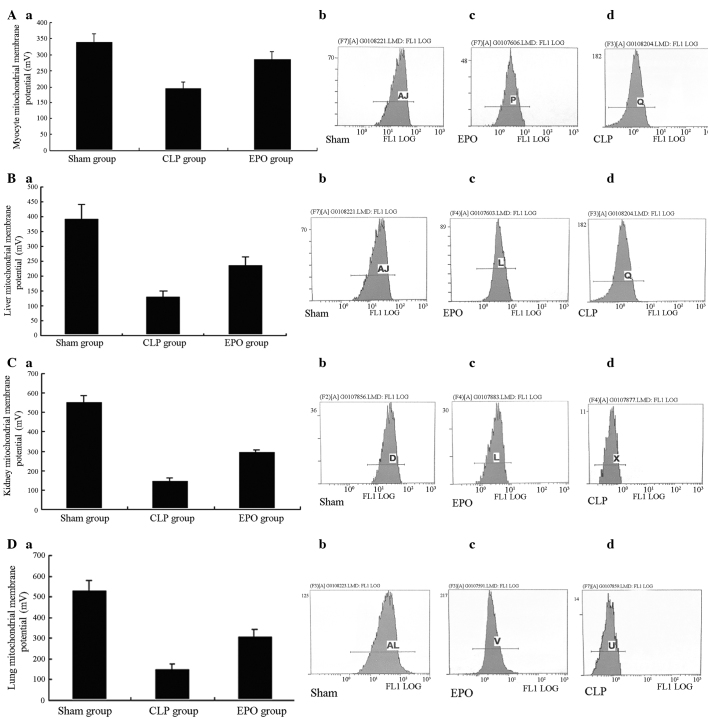
Figure 6.
Comparison of mitochondrial membrane potentials among the groups. Flow cytometric analysis was used to determine the mitochondrial membrane potential of rat (Aa–d) cardiac myocytes and (Ba–d) liver, (Ca–d) kidney and (Da–d) lung cells of each group (Sham, EPO and CLP) 24 h after the CLP surgery. CLP, cecal ligation and puncture; EPO, erythropoietin.

