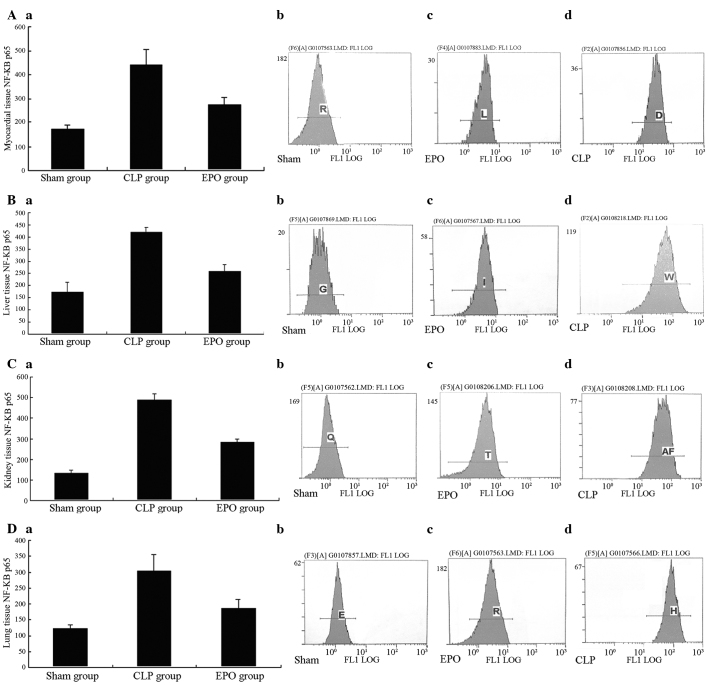
Figure 7.
Comparison of NF-κB p65 expression levels among the groups. Flow cytometric analysis was used to determine the expression levels of NF-κB p65 in rat (Aa–d) myocardial, (Ba–d) liver, (Ca–d) kidney and (Da–d) lung tissues in each group (Sham, EPO and CLP) 24 h after the CLP surgery. CLP, cecal ligation and puncture; EPO, erythropoietin; NF-κB, nuclear factor κ-light-chain-enhancer of activated B cells.

