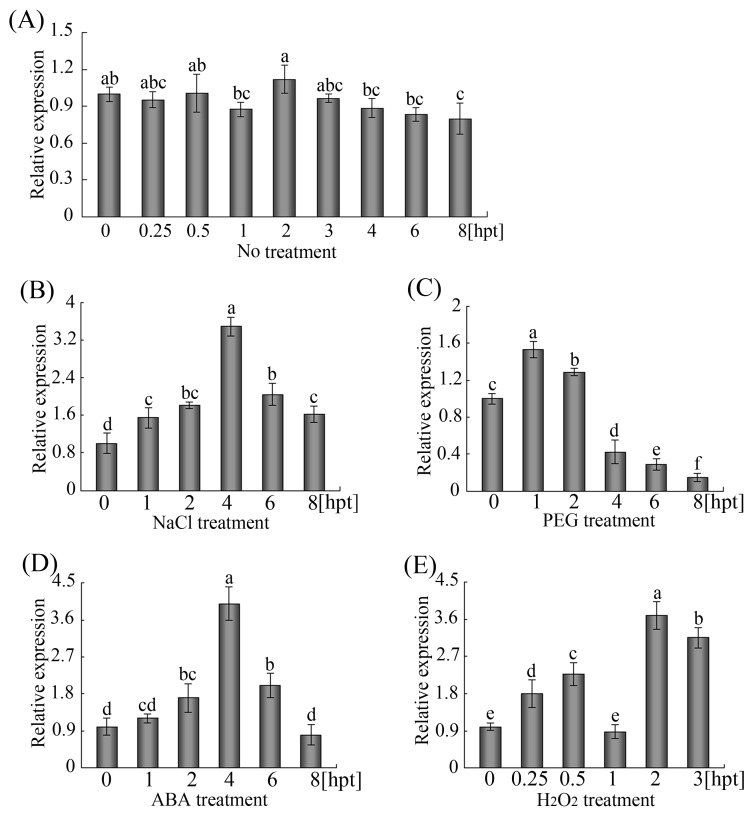
Fig 4. Expression profiles of GhWRKY68 in cotton leaves under various stresses.
Total RNA from cotyledons of 7-day-old cotton seedlings exposed to (A) no treatment (B) 200 mM NaCl, (C) 15% PEG6000, (D) 100 μM ABA, and (E) 10 mM H2O2 were obtained for qPCR. The lanes represent various times during the treatments. The expression profile of cotyledons that did not receive treatment was used as control. GhUBQ was included as an internal control, and the experiment was repeated at least twice.

