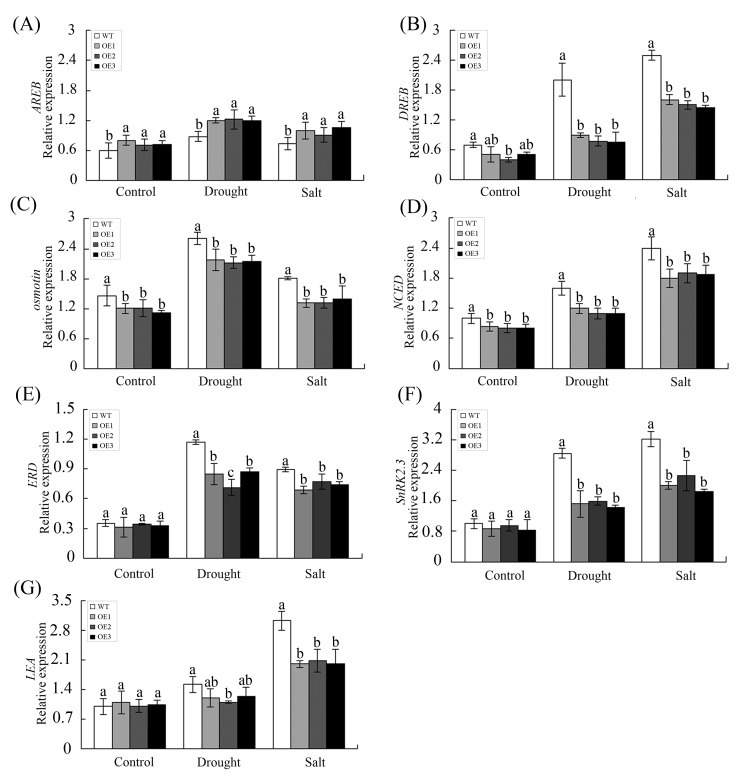
Fig 8. The expression of ABA-responsive genes under drought and salt stress conditions.
(A) AREB, (B) DREB, (C) osmotin, (D) NCED, (E) ERD, (F) SnRK2.3, and LEA (G)correspond to the expression levels of these ABA-responsive genes in WT and OE lines analysed by qPCR. For drought treatment, 8-week-old OE and WT plants were grown in soil without water for 10 days. For salt treatment, WT and OE plants were irrigated with salt water (200 mM) for 1 month. The values represent the means ± SE of three independent experiments. The different letters above the columns indicate significant differences (P < 0.05) according to Duncan’s multiple range test.

