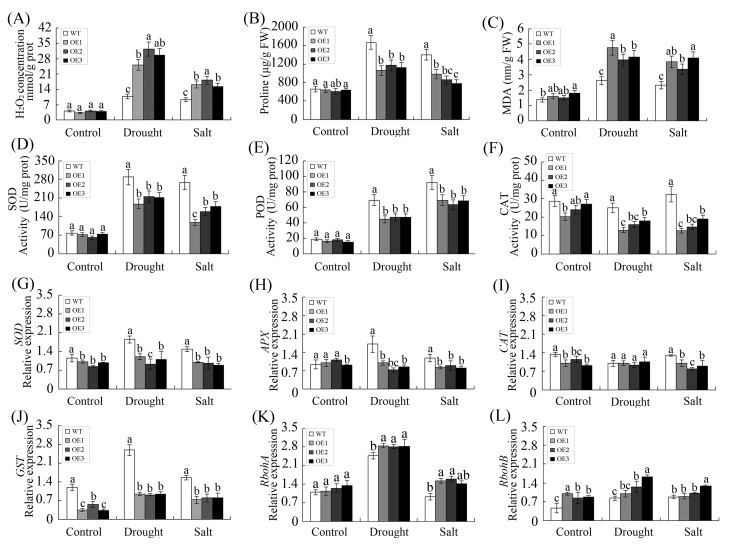
Fig 10. GhWRKY68 overexpression decreased oxidative stress tolerance in transgenic plants under drought and salt stress conditions.
(A) H2O2 concentration in WT and OE plants under drought and salt treatment. (D) Proline content in WT and OE plants under drought and salt treatment. (C) MDA content in WT and OE plants under drought and salt treatment. (D), (E) and (F) represent SOD, POD and CAT activities, respectively. (G) SOD, (H) APX, (I) CAT, (J) GST, (K) RbohA and (L) RbohB expression levels indicative of ROS-scavenging or ROS-producing genes in WT and OE lines analysed by qPCR. For drought treatment, 8-week-old OE and WT plants were grown in soil without water for 10 days. For salt treatment, WT and OE plants were irrigated with salt water (200 mM) for 1 month. The values represent the means ± SE of three independent experiments. The different letters above the columns indicate significant differences (P<0.05) based on Duncan’s multiple range tests.

