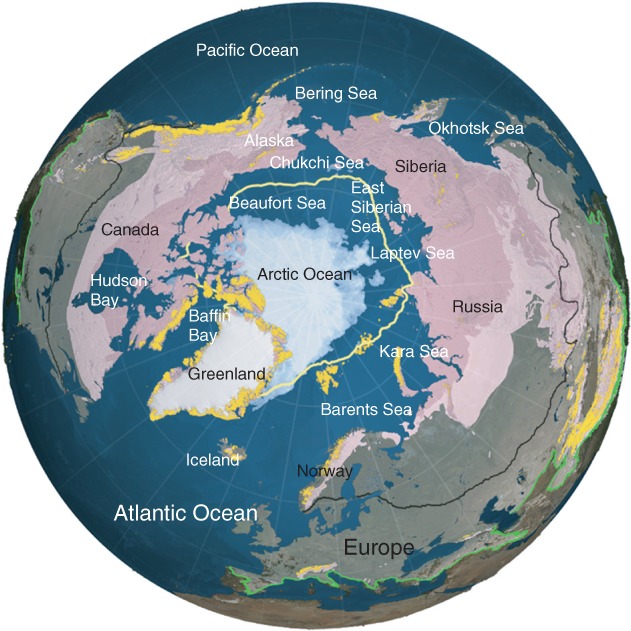
Figure 1.

Location map of the Arctic region including average sea ice extent (yellow line), sea ice cover during record minimum in summer of 2012 (shades of white), continuous and discontinuous permafrost (shades of pink), glacier locations (gold dots), and snow-cover (average location of 50% snow line in black and maximum snow line in green as inferred from moderate-resolution imaging spectroradiometer (MODIS) data).
