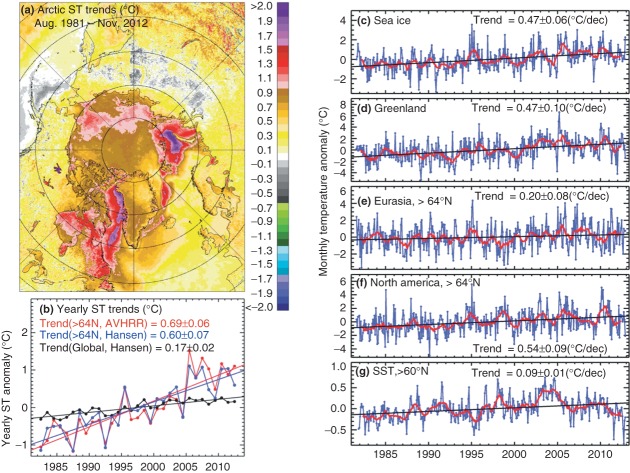
Figure 2.
(a) Color-coded surface temperature trends for the entire Arctic using August 1981–November 2012 advanced very high resolution radiometer (AVHRR) data; (b) plots of yearly anomalies and trends for the entire globe (black) and for the Arctic region (>64°N) using Hansen (2010) (blue) and AVHRR (red) data; and plots of anomalies (blue), 1-year running average (red) and linear trend (black) for (c) sea ice; (d) Greenland; (e) Eurasia, >64°N; (f) North America, >64°N; and (g) SST, >60°N.

