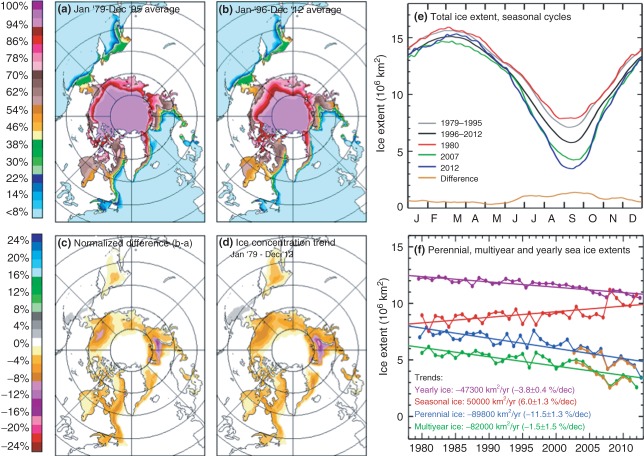
Figure 3.
(a) Color-coded average sea ice concentration map for (a) the period from January 1979 to December 1995; and (b) the period from January 1996 to December 2012. (c) Differences (for each pixel) of averages in (a) with averages in (b). (d) Trend map of sea ice concentration from January 1979 to December 2012. (e) Plots of daily averages of sea ice extent for the period 1979–1995 (in gray), sea ice extent from 1996 to 2012 (in black), difference of sea ice extent between the two periods (in gold, bottom plot); and daily sea ice extent for individual years in 1980 (when summer minimum was highest, in red), 2007 (when summer minimum was second lowest, in green) and 2012 (when summer minimum was a record low, in blue); (f) Ice extents and trends of yearly averages of sea ice extent (purple line), perennial ice (in blue), and multiyear ice (in green) for the 1979–2012 period using SMMR and SSM/I data. Also similar plots from AMSR-E data from 2003 to 2012 (gold) are presented for perennial and multiyear ice.

