
Figure 5.
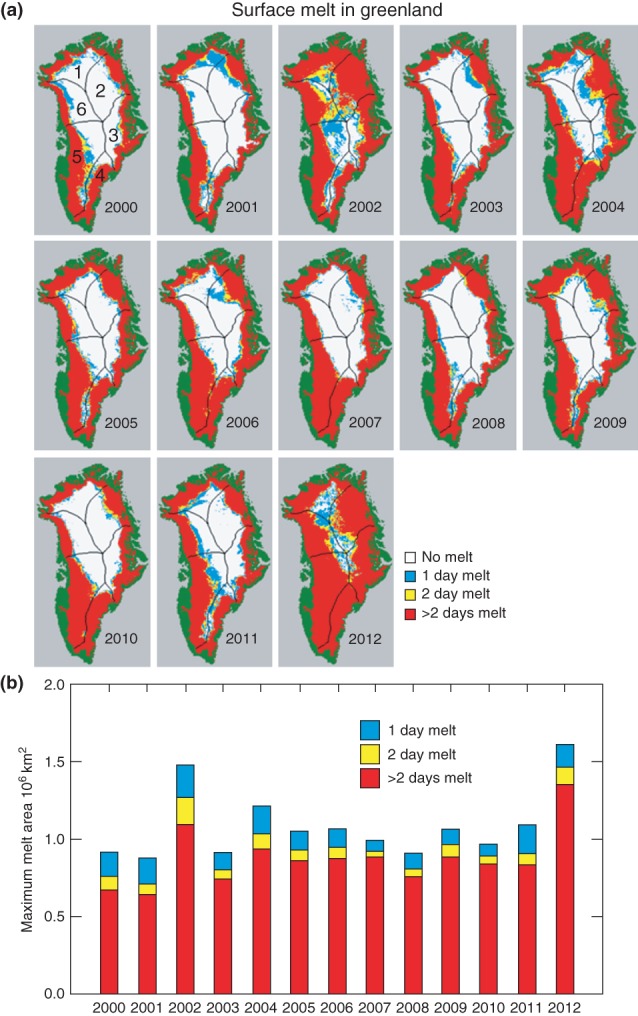
(a) Maps of annual maximum melt extent constructed from moderate-resolution imaging spectroradiometer (MODIS) IST data of the Greenland ice sheet for the study period (March 2000 through August 2012). The nonice sheet covered land surrounding the ice sheet is shown in green. The boundaries of the six major drainage basins of the Greenland ice sheet are superimposed on the maps. (b) Extent of maximum melt in each melt season as derived from the MODIS IST data record; colors relate to those shown in (a). Note the large amount of melt in 2012 that lasted for >2 days. The melt extent in 2002 is also notably large. (Reprinted with permission from Ref 19. Copyright 2007 United States Government as represented by the Administrator of the National Aeronautics and Space Administration)