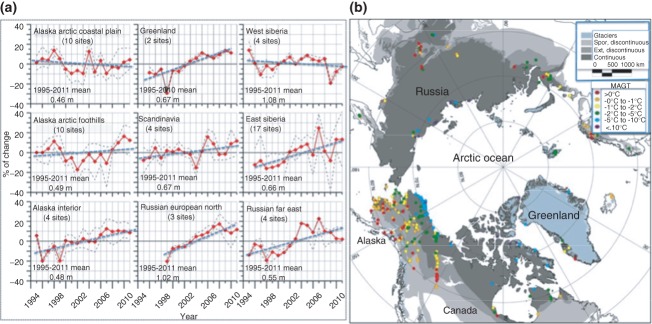
Figure 6.

(a) Circum-Arctic view of mean annual ground temperature (MAGT) in permafrost during the International Polar Year (IPY 2007–2009); (a) active-layer change in nine different Arctic regions according to the Circumpolar Active Layer Monitoring (CALM) program. The data are presented as annual percentage deviations from the mean value for the period of observations (indicated in each graph). Solid red lines show mean values. Dashed gray lines represent maximum and minimum values. Thaw depth observations from the end of the thawing season were used. The number of CALM sites within each region varies and is indicated in each graph. (Reprinted with permission from Ref 101. Copyright 2012 John Wiley and Sons; Ref 96. Copyright 2012 The Northern Publisher Salckhard)
