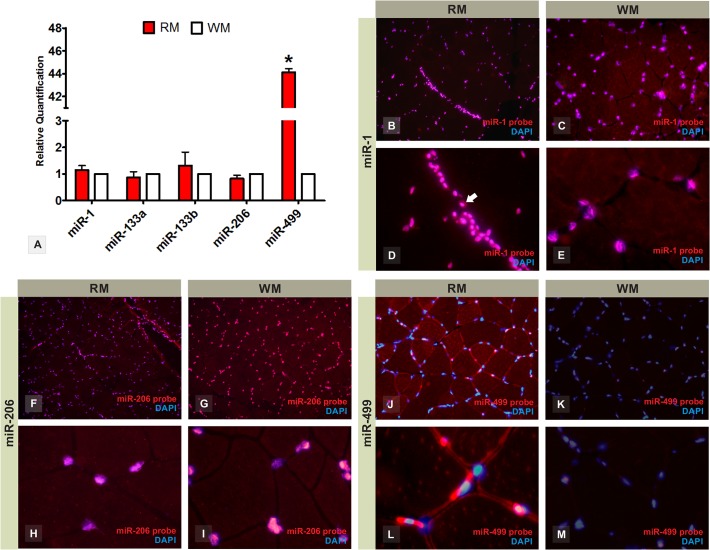
Fig 1. MyomiR expression profile in red and white skeletal muscle fibers of joined males and females adults of Nile tilapia fish.
RT-qPCR shows gene expression levels of myomiRs miR-1, -133a, -133b, -206, and -499 between red and white muscle (A). Relative quantification (RQ) values are relative amount of transcripts shown on linear basis. *Statistically significant in comparison to white muscle (P<0.05). MicroRNA fluorescence in situ hybridization with LNA probes demonstrates the tissue location of miR-1 at 200x magnification (B and C) and 400x magnification (D and E); miR-206 at 200x magnification (F and G) and 400x magnification (H and I); and miR-499 at 200x magnification (J and K) and 400x magnification (L and M) on red and white skeletal muscle fibers. The miR-1 and miR-206 are clearly expressed in muscle fibers and also connective tissue cells (arrow-head), whereas miR-499 is muscle-fiber-specific. RM = red muscle; WM = white muscle.

