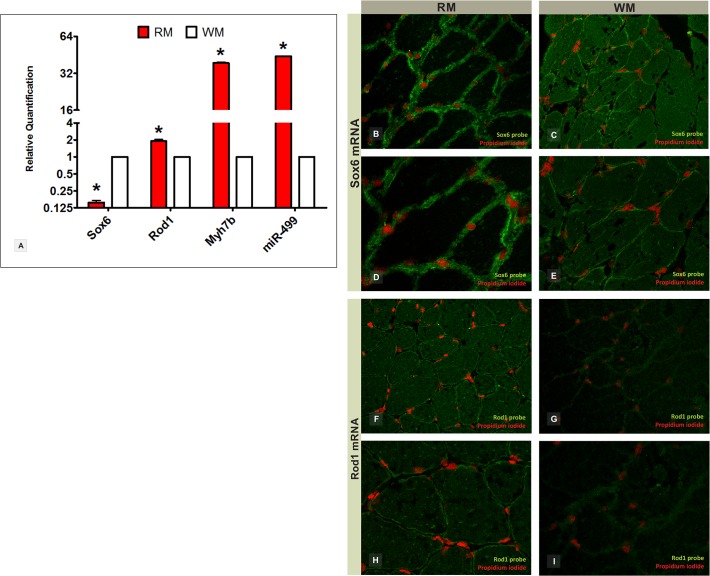
Fig 3. sox6 and rod1 gene expression (miR-499 targets) in red and white skeletal muscle fibers of Nile tilapia.
RT-qPCR shows gene expression levels of sox6, rod1, and myh7b (miR-499 host gene) between muscle cell types (A). Relative quantification values are shown on Log 2 basis. *Statistical significance in comparison to white muscle (P<0.05). RM = red muscle; WM = white muscle; RQ = relative amount of transcripts. Fluorescent in situ hybridization demonstrates the spatial location of sox6 mRNA at 200x magnification (B and C) and 400x magnification (D and E) and rod1 mRNA at 200x magnification (F and G) and 400x magnification (H and I) in red and white muscle fibers.

