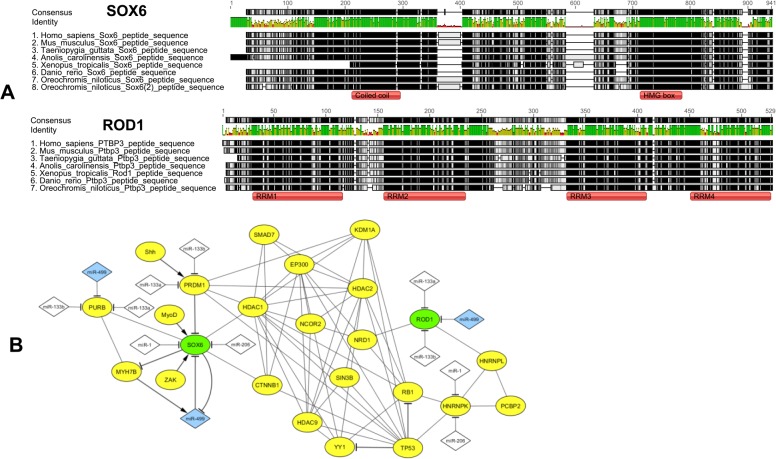
Fig 5. Comparative analysis of protein domains and in silico prediction of protein-to-protein interactions (PPI) in the miR-499 gene regulatory network.
(A) Alignment of SOX6 and ROD1 sequences retrieved from representatives of the main vertebrate groups. (B) mir-499 gene regulatory network based on PPI filtered using gene ontology. miR-499 are indicated as blue nodes and other myomiRs as white nodes, whereas green nodes correspond to miR-499 target genes evaluated. Transcription factors are shown as dashed-line border nodes, and validated interactions are shown as thick-line bridges.

