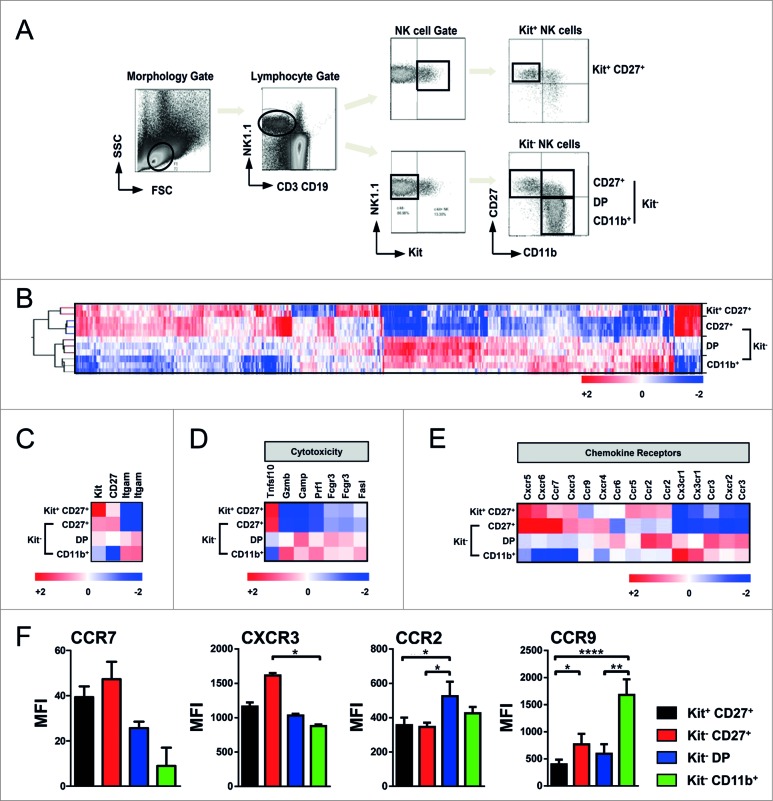
Figure 3.
Gene profiling of murine NK subsets. Transcriptome analysis of phenotypically distinct subsets of natural killer (NK) cells in mice. (A) Gating strategy of C57Bl/6 splenocytes for MoFlo sorting of NK cell subsets. Viable single NK1.1+ and CD3−/CD19− cells were distinguished based on expression of c-Kit, CD27 and CD11b. (B) Gene profiling of the four pre-dominant NK cell subsets. Unsupervised hierarchical clustering (i.e., Pearson centered, average linkage) of significantly regulated genes (at least 2-fold different from the median of all samples) of MoFlo sorted NK cell subpopulations from 2-3 independent experiments. Relative microarray expression levels are represented by a pseudocolor scale, as indicated. (C) Gene clustering of mean values of genes for the characteristic expression of NK surface molecules c-Kit, CD27 and CD11b (Itgam). (D-E) Genes were grouped according to their gene ontology. Gene clustering of mean values from 2-3 independent experiments of genes involved in cell-mediated cytotoxicity (D) and chemokine receptor expression (E). (F) Cytofluorimetric analysis of expression of different chemokine receptors performed on enriched NK cell subsets isolated from C57Bl/6 splenocytes. Mean ± SD of CCR7, CXCR3, CCR9 and CCR2 on Kit+CD27+ (black), CD27+ (red), Kit−CD27+CD11b+ (DP; blue) and CD11b+ (green) NK cells are indicated. Histograms depict the mean fluorescence index (MFI) of expression levels on NK cell subsets from 3 experiments. Error bars represent SD. Statistical significance was determined by Kruskal-Wallis test; *p<0.05; **p<0.01; ****p<0.0001.

