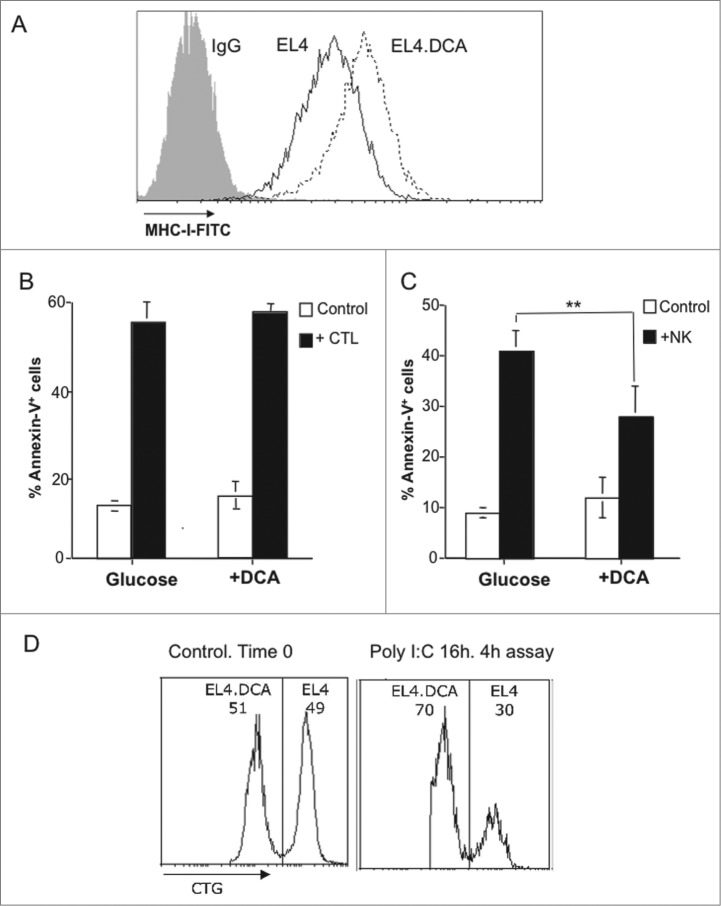
Figure 8.
DCA effects on MHC-I expression in EL4 cells and sensitivity to CTL and NK cells. (A) EL4 cells were cultured during 3 d in medium containing 25 mM glucose in the absence (black histogram) or in the presence of 15 mM DCA (pointed histogram). MHC-I expression was analyzed by flow cytometry as indicated in the legend of Fig. 1. The black histogram corresponds to the labeling by a control Ig. (B) Antiviral CD8+ T cells were tested against EL4 cells supplemented or not with DCA, as indicated in the legend of Fig. 3. The percentages of Annexin-V+ cells are shown, at the basal level (white bar), or after the 2 h incubation with the antiviral CTL from wild type mice (black bar) Results were the mean ± SD of three different experiments. (C) NK cell-mediated cytotoxicity was tested on EL4 cells supplemented or not with DCA, as indicated in the legend of Fig. 4. The percentages of Annexin-V+ cells are shown, at the basal level (white bar), or after the 4 h incubation with activated NK cells from wt mice (black bar). Results are the mean ± SD of four different experiments. (D) 5 × 10⁵ EL4 cells cultured during 3 d in medium containing 25 mM glucose in the presence of 15 mM DCA were labeled with 0, 5 μM (CTGlow) and those cultured in the absence of DCA were labeled with 5 μM cell tracker green (CTGhigh), respectively, and mixed at a 1:1 ratio (Control. Time 0). Labeled target cells were then injected i.p. in 200 μL RPMI 2% heat-inactivated FBS in wild type mice injected 16 h before with 0.1 mg poly-IC in 0.1 mL PBS (+poly I:C). Mice were sacrificed 4 h later and peritoneal cells collected, washed in PBS, and analyzed on a FACSCalibur flow cytometer.

