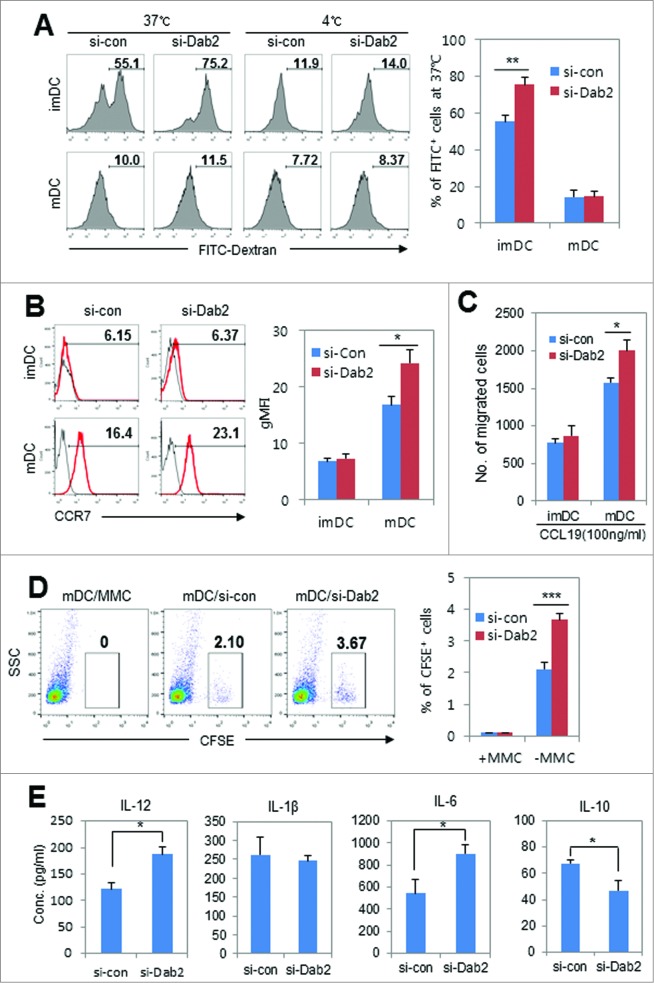
Figure 4 (See previous page).
Effects of Dab2-silencing on antigen uptake, migration, and cytokine secretion of BMDCs. (A) WT or Dab2KD imDCs and LPS-stimulated (100 ng/mL for 24 h) mDCs (2 × 10⁵ cells) were equilibrated with 1 mg/mL FITC-conjugated dextran for 1 h at 37°C or 4°C, respectively. Cells were washed and analyzed by flow cytometry. Representative flow cytometry of FITC+ cell populations is shown (left) with the mean ± SD of 9 samples pooled from three independent experiments (right). **p < 0.01, *p < 0.05 compared with control imDCs and mDCs. Student's t-test. (B) WT or Dab2KD imDCs and LPS-stimulated mDCs were stained with PE-conjugated anti-CCR7 mAb followed by FACS analysis. Representative flow cytometry analysis of the CCR7+ cell populations (%) in imDCs and mDCs (left) and accumulated statistical data (right) are shown with the mean ± SD of 9 samples pooled from three independent experiments. **p < 0.01, Student's t-test. (C) The migration of WT and Dab2KD imDCs and mDCs was assessed by an in vitro chemotaxis assay as described in the materials and methods. The data are shown as mean ± SD of nine samples pooled from three independent experiments. *p < 0.05, Student's t-test. (D) In vivo migration assay with Dab2KD BMDC was performed as described in materials and methods. CFSE-labeled Dab2KD or WT mature DCs (1 × 10⁶ cells) were inoculated s.c in the right flank region of C57BL/6 mice. After 24 h, CFSE-labeled DCs in the inguinal lymph nodes were examined by flow cytometry. Mitomycine C (MMC)-treated (50 μg/mL for 30 min) CFSE-labeled BMDCs were used as a negative control. Representative FACS data (left) and statistical data from three independent experiments are shown as mean ± SD (right). ***p < 0.001. (E) Cytokine production was assessed by ELISA of WT and Dab2KD BMDC culture supernatants after stimulating with LPS (100 ng/mL) for 24 h. The data are shown as mean ± SD of nine samples pooled from three independent experiments. *p < 0.05 compared with control mDCs, Student's t-test.

